Enrich Your Organization With
Business Intelligence Solutions
Are you looking to empower your daily reporting, operations, and insights sharing? If so, then congratulations on finding the best business intelligence solutions provider. Allied Consultants provides a BI framework that enables the presentation of raw data from various systems into meaningful and useful reports that can be used to better run businesses.

Key Features Of Business Intelligence Solutions
Data Integration
Our specifically designed business intelligence platform helps to gather and consolidate data from various sources, including databases, spreadsheets, and APIs, into a unified data repository. Then we clean, preprocess, and transform raw data into a structured format suitable for analysis. Experience the transformation as insights emerge from a unified and refined data landscape, driving informed decisions and strategic growth.
Data Visualization
Our business intelligence solutions excel in graphical data representation, simplifying pattern and trend discovery. Visualizations range from bar graphs, line graphs, Pie charts, Surface Area charts, Scatter plots, Heat Maps, bubble, doughnut, and radar plots, accommodating diverse data sources—ERPs, ERPs, Text, Excel, OLEDB/ODBC-compliant systems.
Big Data Analytics
Big data analytics enables the processing of very large amounts of structured and unstructured data through parallel processing. Big data architecture reduces or eliminates the need to aggregate or pre-aggregate data in the form of pre-defined cubes. Our business intelligence system supports implementation through cloud variants of Hadoop and enables the presentation of this information through the conventional presentation tools described above.
Data Warehousing
Elevate your data management with our state-of-the-art business intelligence software. Discover the power of centralizing your data storage and organization through advanced data warehousing technologies. This centralized hub optimizes data accessibility, ensuring that businesses can efficiently manage and analyze large volumes of information for a better decision-making process. That facilitates valuable insights.
User Self-Service
Experience user empowerment with our smart business intelligence solutions. Our dashboards facilitate user self-service, minimizing IT involvement. Through a user-friendly portal, individuals craft informative reports. The advanced technology empowers users to seamlessly add widgets, incorporate new users, and dissect data for presentation.
Cloud Collaboration
Leverage collaborative potential with our business intelligence solutions. The dashboards are available in both on-premise and cloud variations. Beyond visualization, our solution seamlessly integrates with online databases, embracing Platform as a Service (PaaS) and Data as a Service (DaaS) models, including Microsoft Azure and HD Insight. Empower your team to collaborate effortlessly across platforms, enhancing data-driven decision-making and accessibility.
KEY BENEFITS
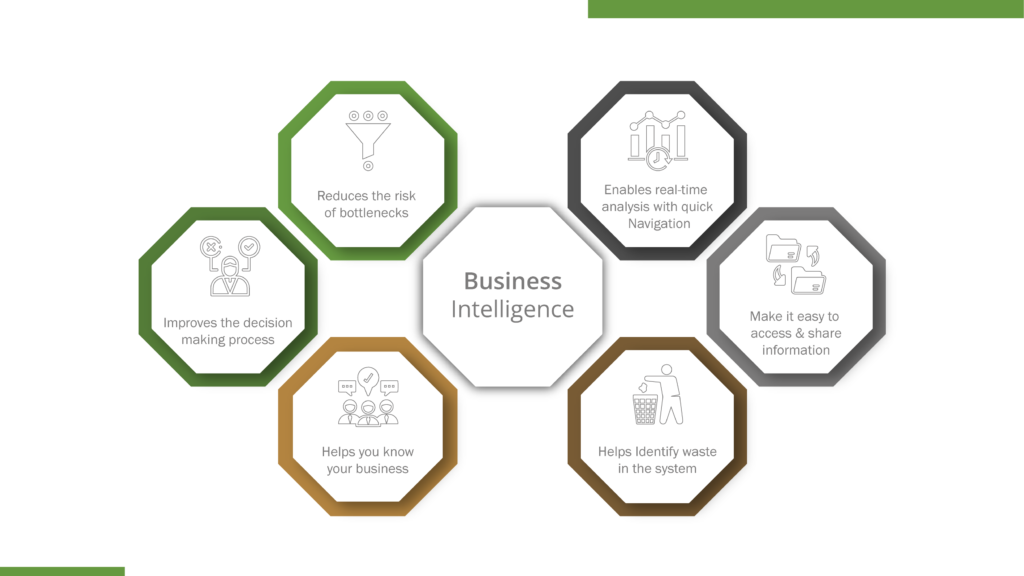
- Enables Data based decisions
- Responsible Organizations
- Data availability where and when required
- Customer insight Cross/Up Sell
- Streamline Operations
- Improve Efficiency
- Identify hidden business trends
Explore how IT can help your business by
Industry
- Energy
- Border and Identity management
- Mining and Oil & Gas Extraction
- Telecommunications
- Pharmaceuticals and Healthcare
- Media and Publishing
- Chemicals
- Agriculture and Forestry
- Textile
- Electronics and High Tech
- Wholesale and Distribution
- FMCG
- Banking and Finance
- Automotive
- Insurance
- Retail
- Government and Public service
- Real Estate & Construction
- Non-Profit
- Freight, Logistics, Transportation & Warehousing
- Healthcare
- Accomodation and Food
- Construction & Engineering
- Education and Research
- Entertainment, Recreation and Arts
- Manufacturing
- Miscellaneous
- Professional and Technical Services
- Law services
- Utilities
- Travel and Tourism
Business Function
- Finance and Accounting
- Human Resources
- Procurement, Supplier and Outsourcing
- Property and Facility
- Quality Improvement and Innovation
- Supply Chain, Inventory and Logistics
- Support
- Project Management and governance
- Operations
- Information Technology
- Manufacturing
- Sales and Marketing
Shareholder Value
- Improving Asset Efficiency
- Inventory
- PP&E
- Receivables & Payyables
- Increase Operating Margin
- COGS
- Income Taxes
- SG&A
- Managing Market Expectations
- Revenue Growth
- Price Realization
- Revenue Volume
Technology
- Business Intelligence
- BigData
- Enterprise Application Integration
- Internet Of Things (IoT)
- Mobile
- SharePoint
- Virtual Reality
- Web
- Collaboration
Explore how IT can help your business by
Industry
- Government and Public service
- Real Estate & Construction
- Non-Profit
- Freight, Logistics, Transportation & Warehousing
- Healthcare
- Accomodation and Food
- Construction & Engineering
- Education and Research
- Entertainment, Recreation and Arts
- Manufacturing
- Miscellaneous
- Professional and Technical Services
- Law services
- Utilities
- Travel and Tourism
Business Function
Shareholder Value
Technology
Frequently Asked
Business Intelligence (BI) refers to the process of collecting, analyzing, and transforming data into actionable insights to support better decision-making. BI is crucial as it empowers organizations to gain valuable insights from their data, improve operational efficiency, and stay competitive in today’s data-driven landscape.
Yes, Allied offers scalable business i reach ntelligence services suitable for small and large businesses alike. We tailor our services to your specific requirements, ensuring cost-effective and impactful BI implementation.
Getting started is easy! Simply out to our team through our contact form or phone number, and we’ll schedule a consultation to discuss your BI needs. We’ll work together to create a tailored solution that suits your organization’s goals.
Recent Blogs
Straddling these two worlds makes for a hell of a person. It’s a fire sign and ruled by the headstrong Ram, making them stand their ground and refuse to be pushed around. Conventional family values are something they strictly follow, for example https://astrozella.com/may-taurus-vs-april-taurus/. So, she will do anything within her means to ensure it clings to every chance that pops up in her career.
If that’s not enough, you can share photos on social media and do more, thanks to IFTTT. There were a ton of backpackers there on longer term trips also interested in hanging out, tons of cheap activities and cheap steak so people can do stuff together easily, and even stayed at a hostel with free wine! Because they are an active dog breed, the Vizsla needs something to keep them busy if they are left alone – like a puzzle treat box or a proper dog toy more info. It’s no surprise, but summer is peak tourism season for Kennebunk, Kennebunkport, and the surrounding area, and like most of Maine’s coastal towns, the Kennebunks turn into sleepy towns in the winter.
The cup should encompass your breast and provide a smooth transition from bra to breast, with no skin squeezing out of the top. The wings stimulate your lateral clitor. The shape of the toy and the weight of the steel do a lot of the work for you https://kinkazoid.com/male-masturbators/. A DIY pussy will help you reach the climax, but it can’t be compared to the one you can get with professional models from Spider, Meiki, Fleshlight or Rends.
For women, this can be a great way to control the amount of stimulation they’re receiving. Odette Lace Eye Mask Black. Since we’re on the topic of long term wear I’ll address the second most asked question: How do you go to the bathroom https://911cashtilpayday.com/. In case you forgot that the internet is full of pretenders and people who say they’re something or someone they aren’t, we’ll remind you again.
Physical arousal involves direct and indirect stimulation of erogenous sensory nerves. Still, it’s fair to say that none of these choices are purely aesthetic, and the Tentacle’s form does provide some amazing texture and stimulation. Variations: Dildo choices are endless, and range in size, shape, and color dildo mouth gag. With sturdy nylon straps that can hold up to 250 pounds, you and your partner can take turns swinging and turning as you experiment with multiple sex positions.

AlliedConsultants
March 26, 2024